Tuesday, June 22, 2010

Government Still Struggling With Mortgage Modifications + Five Times As Many Homeowners Bounced - As Granted New Relief

[mEDITate-OR:
fail to see the failure for what it really is...
or not hear the fat lady singing.

They told U.S. that they would address/solve the mortgage crisis.
They did not, they are not, they will not.

They asked U.S. to apply for help..., and many of U.S. did.
The big banks record is less than 25% of those who applied were even offered a trial modification. They never intended to make them.

Completed foreclosures soared to 93,800 in May, up from 65,000 a year earlier
while delinquency rates for borrowers with the best credit history jumped a full point to 5.9% in the first quarter.
Borrowers who owe more than their house is worth rose to 11.3 million in the first quarter, up from 10.2 million a year earlier.

What this will mean is another massive flood of foreclosures.

=========
Government Still Struggling With Mortgage Modifications
hamp scorecard 2010-05.PNG
http://www.theatlantic.com/business/archive/2010/06/government-still-struggling-with-mortgage-modifications/58461/
=========
Borrowers exit troubled Obama mortgage program
LOAN_MODIFICATIONS
http://www.google.com/hostednews/ap/article/ALeqM5gyoZ46fqVwnds84XZfpZHVMrkGCgD9GFVUIO0
==========

Five Times As Many Homeowners Bounced

From Obama Plan To Slow Foreclosures

As Granted New Relief


http://www.huffingtonpost.com/2010/06/21/hamp-homeowners-foreclosures-relief_n_619356.html
===========
Troubled borrowers get help
outside Obama mortgage plan
=======

A slow Europe could still lead to a slow China

[mEDITate-OR:
slowly realize that a falling EURO hurts China more than we think...
and that is NOT good news..., for U.S.

This is the best pictorial/explanation we have seen for why we have not seen, yet, a decline in Chinese exports to Europe following the steep drop in the value of the EURO. It takes 3-6 months for the drop in deliveries..., to follow the drop in orders..., following the drop in funds - lending - to support it.

chart_ecb.top.gif
What that is showing U.S. is that what we are now seeing in shipments is NOT what we will be seeing over the next few months.

China is in trouble. Bcuz, the EURO is in trouble.

This is not good.

If we DO see a precipitous fall in European imports from China
there will be another steep decline in Chinese jobs & income.
They will NOT sit, quietly, by and let that happen.

===============
A slow Europe could still lead to a slow China
FORTUNE -- If we have learned anything in the last few years, it's that all major markets are connected.
==============

ConsumerMan: Credit unions pick up steam - Beckoning With Open Arms

[mEDITate-OR:
watch your big banks gamble your money on risky "investment" banking...
instead of lending to you OR your local small businesses.

What Terry Rielly, who worked for a bank in Seattle earlier, told me over 25 years ago is that "banks" no longer are in the check "cashing" Or in the personal loan business. They did not WANT little ol'  "customers" like U.S.!

What they DID want to do was take {y}our money, put it into a "credit card", and then take more of it.

Today, since the RE bubble's collapse, what banks ARE doing is, literally, ripping you off...
in order to cover up/over their bad lending losses = Excessive credit card losses, excessive "home equity loan" losses, excessive "commercial" & "construction" loan losses.

What they are NOT doing is lending to other businesses.

-------------
ConsumerMan: Credit unions pick up steam
Anger over Wall Street bailout drives memberships
 
Add up all the deposits and credit unions now have nearly 10 percent of the household savings in this country. That's their biggest share of the market ever.
---------------
Credit Unions Are Beckoning With Open Arms
===============

FHA calls itself 'outdated' - ready to join the 21st century

[mEDITate-OR:
not feel as "outdated" as you probably are...
whether you like it or not.

However, what you NEED to know/remember is that after July 08, when the RE mortgage market collapsed, what FHA did was enroll a huge number of new mortgage originators, without any controls.

Then FHA expanded from less than 5% of the RE market to now over 25%.
Why..., bcuz the scumbags who WERE doing subprime and liar ARMs switched over to creating FHA low down payment RE loans.

Guess what..., the number of problem RE loans at FHA did exactly what they did at FMae&Fmac..., they exploded.
So..., the numbers on this chart are LOW...
but, better luck this year.

Go figure...
how much that is gonna cost U.S.
{that is not a question...}
----------

-------------
Street Sweep
Following the money in banking and economics
JUNE 18, 2010, 3:09 PM
FHA calls itself 'outdated'
The Federal Housing Administration is ready to join the 21st century -- and not a moment too soon.

For instance, ...the agency's loan-level reviews "lack the detail necessary to swiftly and efficiently identify loans that have the potential to result in delinquency, default and/or foreclosure.
====================

More bets against cash-strapped states: How ugly are the state budget problems?

[mEDITate-OR:
forget that Californication is larger than most nation states...

And, GD (gall darn) near as far in debt.

However, while nation states may have control over their own economies...
states are U.S. more often than not do not.
for example, Medicare & Medicaid expenses...

What the Feds, not justly, are doing is cutting "doctor reimbursements" by 21%
in the middle of each states budget year.
So, states like Cal, Az, WA and OR have already PAID doctors for 6 month billings.

What was the line:  "No more unfunded mandates!"

Ha..., did we fool you.

------------
============
Street Sweep
Following the money in banking and economics
JUNE 18, 2010, 7:35 AM
More bets against cash-strapped states
How ugly are the state budget problems?

Nasty enough that traders are betting that two big U.S. states, California and Illinois, are just as apt to default on their bonds as Portugal -- and almost as likely as Iraq.

Monday, June 21, 2010

Americans love their Treasurys

[mEDITate-OR:
wonder not why some seek safety with no rewards...

Why, for example, would China and Japan ship goods to U.S.
and park the money we give them for those goods.
in very low interest TBills...?

Why would they not buy soybeans and wheat and things that ONLY can be obtained from U.S.???

Even MORE questionable, Why did YOU buy US$ 147 Billion TBills in the 1st Q of this year?

Explain THAT to me..., if you can.

=================
Americans love their Treasurys
Look out, China. U.S. households are now the second-biggest owner of Treasury debt.
JUNE 21, 2010, 6:41 AM


The U.S. household sector bought $147 billion of Treasury securities in the first quarter, the Federal Reserve said in its quarterly flow of funds report. That pushes Americans' holdings of Treasury debt to $796 billion, the highest level since 1999.
=============

On Fannie and Freddie REO Inventory + REO: Agencies vs. Private Label + How Many Homes Do Banks Have Up Their Sleeves?

[mEDITate-OR:
place the blame in the wrong places for the wrong reasons....
 
The first chart is in fact three charts of the number of foreclosed homes.
Barclays is ONLY non-agency "securitized RE packaged" loans.
RealtyTrac and Lawler have attempted to cover ALL loans
 
Compare them to SEE where we are.

What this suggests to U.S. is that the first wave of foreclosures were those non-agency subprime and ARM loans made in the sand states.
and, that now the foreclosures are more unemployment & prime RE loans related.
 
-----------
==============
Note:  all CR charts are available in LARGE format on their web site.
=============
This graph shows the increase in Fannie, Freddie and FHA REOs through Q1 2010.
Here is the graph Tom Lawler constructed for REOs at the end of Q4 2009:
============
============

Sunday, June 20, 2010

Home Values Likely Headed Down to New Lows

[mEDITate-OR:

One of the true puzzlements of our time is how many ARM resets really ARE left out there. Is your ARM reset graph what was then, or what is left now?

Take these numbers, for example:
The report also found that an estimated 2.5 million foreclosures were completed between 2007 and the end of 2009.
This is roughly one in every 20 mortgages outstanding at the time of the crisis.
More than eight in 10 of these foreclosures were on owner-occupied homes with mortgage originated between 2005 and 2008.
An estimated 5.7 additional foreclosures are imminent.

See, here is The Problem:
MOST of the mortgages originated between 05 & 08 were sand state ARMS and subprimes. According to another Alpha article that was US$ 2.5 Trillion NON-agency securitized packaged RE loans between 04 and 08.
The sand states have MOST of the underwater RE loans, MOST of the foreclosures, MOST of the strategic defaults, AND had MOST of the ARMs.

So, how many sand state ARM re-sets ARE there still left out there? Who, in Hell, like those of U.S. in Arid-Zone-Ah, really knows?

-----------------

Eric, permit me to focus/clarify.

IF there really are 5.7 imminent foreclosures, are you not also aware that MOST of the pending foreclosures and short sales are IN the same sand states?

See, here is The Other Problem:
The sand state ARM re-set problem and the imminent foreclosure problem may not be two problems, but the same one looked at from a different direction. And, if THAT is true, as we suspect that it is, then to say that the "re-set" problem no longer exists, or went away, probably is wrong.

And that does not factor in the "negative amp ARM's" - where a low current interest rate will not necessarily save them, much, from the new larger monthly payments. Nor the "liar loans", where they never did have the income to make the payments.

-------------

---------
Home Values Likely Headed Down to New Lows
http://seekingalpha.com/article/210753-home-values-likely-headed-down-to-new-lows?source=dashboard_macro-view#comment_update_link
-------------
Tack, the replacement cost vs existing mortgages may NOT be inaccurate, depending on where you live.

In two recent article in the AZRep they report that fully developed building lots are being scooped up at a fraction of peak costs/values; and that builders, using less expensive employees and cost of materials, are able to BUILD and sell a new home at 40 to 50% less than at peak costs. What this suggests to U.S. is that IN the sand states where all Hell is broke (pun) loose, not only are there most of the ARM resets, and underwater current owners, BUT, and it is a big butt, the replacement cost for inexpensive homes AND your McMansions HAS dropped precipitously.

Add to that the continued lack of Jumbo RE loan sources, and massive loss in incomes/jobs/businesses, even for the rich and moderately so, and there is extreme downward pressure.

There really are two totally different RE worlds out there affecting U.S.!
------------

Tack, permit me to clarify.

In AZ we now have a "normal" supply of inexpensive homes - 4 to 6 month. However, we also have a multi-YEAR supply of expensive homes. The McMansions simply are not selling, at any price.

Second, which "replacement cost" are we - apberusdisvet, you and U.S. - taking about. Peak market then vs sand state now?

==========

US Consumer Credit in April

[mEDITate-OR:
miss the problem..., cars and not butter...

This chart from last week form EconGrapher shows U.S. the latest credit data. But note, as they did that there was:
a $9.4 billion increase in non-revolving credit (reflecting strong car sales)
off set by an -$8.5 billion decrease in revolving credit.

What we are doing is buying long term durable goods, like cars, and we are NOT using our credit cards to buy "stuff" as much as we were. Good for the automobile industry, BAD for retail sales - restaurants & shopping malls.
-----------

-----------
4. US Consumer Credit
US consumer credit rose by $1billion in April, matching consensus and beating the previous (downwardly revised) -$5.4 billion. The gain was driven by a $9.4 billion increase in non-revolving credit (reflecting strong car sales), off set by an -$8.5 billion decrease in revolving credit. The chart below shows what looks like a turning of the corner for consumer credit, and this lines up with the trend in the labour market. However arguably this number should still be contracting due to the need for consumer deleveraging to continue, the US personal savings rate was reported as 3.6% in April, which is towards the higher end compared to recent times for the US, but work still needs to be done in deleveraging, and increasing the savings rate (similar but in different direction to the China rebalancing above), for a more structural and sustainable recovery in the US.


=======

China Announces Yuan Flexibility: So What's Next?

[mEDITate-OR:
reform yourselves in the wrong direction...

These are three more very interesting charts from EconGrapher's web site/blog & article on Seeking Alpha.

The first article is an opinion on the Chinese announcement about lifting the Peg on the Yuan to the US$. This is worth reading.

The other two charts are different ways to look at China's economy.
-----------
China Announces Yuan Flexibility: So What's Next?
http://seekingalpha.com/instablog/475379-econ-grapher/77480-china-announces-yuan-flexibility-so-what-s-next
-----------

---------------
We need to remember WHEN China pegged the Yuan - July 08. Six months after the Jan 08 collapse of "securitized RE mortgages", and the same month they announced that they would stop buying FMae&FMac bonds, and shift over to TBills guaranteed by U.S. Two months later W "nationalized" both FMae&FMac and began shifting China's TBill purchases back over to buy FMae&FMac mortgages, so F&F could begin to continue to make U.S. home loans - the ONLY home RE loans available at that time.

China was terribly worried about the value of their US$ 1.5 Trillion investments in U.S. - part TBills and part FMae&FMac RE mortgage bonds; and shifted to safer TBills AND also pegged the Yuan.

IF China had allowed the Yuan to rise, when ours was falling against the Euro, they would have taken a one-for-one hit for every percent increase in the Yuan equal to a loss on their money with U.S. AND they would not have gained trade market share in Europe.

Now, the Euro [& their largest trading partner] has collapsed, to save THAT foreign market, the Yuan needs to fall, not rise. If the Yuan does rise, for China it will make a bad situation in Europe worse and a current good situation with U.S. turn bad.

Be very careful what you ask for, you might get it.

Note that for each percent drop in the Yuan, China will make an equal gain on their money with U.S. - and the loss of trade with U.S. might be more than offset by reduced trade losses, or even gains with Europe.

-------------

--------------

==============

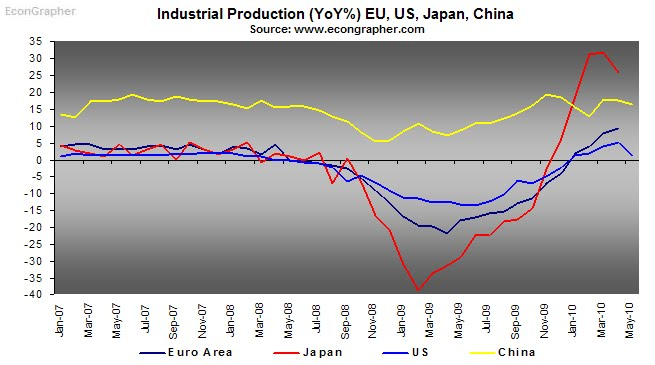
Top 5 Graphs of the Week: Industrial Production, Commodities, Inflation

[mEDITate-OR:
produce dis'ed-information 4 U.S.

Another very interesting Graph & Chart site...
While they provide U.S. with 5 each week...
their first one is the most interesting.

The top five - excluding Germany, sorta - show U.S. what is occurring.
And, below is
http://econgrapher.blogspot.com/

We are including both the article small chart and the blown up one, to see how the later posts.
--------
============
Top 5 Graphs of the Week:
Industrial Production, Commodities, Inflation
-----
1. Industrial Production
Industrial production figures released over the week showed no real surprises with the pattern broadly in line with the expected path from recovery. The US showed a deceleration in Industrial production growth as the comparator figure started to recover; still too soon to call a double dip but it will pay to watch the rest of the data. Japan also saw a slight deceleration in its industrial production recovery - as the trade dependent economy continues to rebound from the deep drops during the height of the crisis. The EU showed continued signs of recovery or renormalisation, and the China data - there for comparison showed continued strength. S Industrial Production has shown a period of deep contraction followed by short term recovery; the question is - where to next?
Click to enlarge images
http://seekingalpha.com/article/210859-top-5-graphs-of-the-week-industrial-production-commodities-inflation?source=email
==========

Nevada takes dubious jobless title from Michigan + What if there's no fix for high unemployment?

[mEDITate-OR:
have the sand shift out from under you..., again...

"Trickle down" effects are not alway obvious, sometimes they are.
One has to ask:  "Is this change in Michigan's UI rate based upon more automobile sales/hiring..., or is it based upon the withdrawal of UI victims from the game.
We have seen a large drop in applicants for jobs. When things started to pick up, they came back out of hiding, and started to look to see if there were any new jobs available. There were not very many, so they went back under the rocks.
Is that what happened in Mich?
----------
This second article is meant to scare you.
If THIS prognostication is even close to accurate, we are all in very deep trouble.
The "consumption" society will hemorrhage - jobs and money.
-------
Nevada takes dubious jobless title from Michigan
===========
What if there's no fix for high unemployment?
============
Nevada takes dubious jobless title from Michigan
By Hibah Yousuf, staff reporter
June 18, 2010: 12:48 PM ET
chart_unemploy_rate.top.gif
=============

Unofficial Problem Bank List increases to 781 Institutions

[mEDITate-OR:
wait to be ill-informed...

"Trickle down" economic news..., more banks are in trouble.

This CR chart is able to be re-ordered, just click on columns.

However, while you are thinking about do that..., LOOK @ this CNN chart !!!


==============
Friday, June 18, 2010
by CalculatedRisk on 6/18/2010 11:45:00 PM
Sheila may be taking it easy, but surferdude808 is working hard
Note: this is an unofficial list of Problem Banks compiled only from public sources.

Here is the unofficial problem bank list for June 18, 2010.
http://calculatedriskimages.blogspot.com/2010/06/unofficial-problem-bank-list-june-18.html
==========
Street Sweep
Following the money in banking and economics
JUNE 17, 2010, 11:04 AM
More bank failures are coming
Get ready for another wave of bank failures

http://wallstreet.blogs.fortune.cnn.com/2010/06/17/more-bank-failures-ahead/#more-911
=========

Friday, June 18, 2010

Foreclosure crisis hits minorities harder

[mEDITate-OR:
remember that when Bill Clinton was pushing for more minority ownership, he was thinking more about African Americans.
However, when W Bush was pushing for more minority ownership, HE was thinking more about Latino ownership.
= Mexicans in Cal, Nev, Az, Texas..., and Cubans in Florida.
chart_foreclosure_rate.top.gif
African-Americans and Latinos are losing their homes to foreclosure at a higher rate than whites
People who buy new homes tend to be, and become, more conservative.
Hence, W's game plan.
{Latinos did play The Game according to W's rules...
they voted stronger for Obama, the ingrates.}
[who they blame for these foreclosure numbers will have MAJOR impact on the next election]
However, NOTE not only when these RE loans were made = 2005 to 2008
And, WHERE these loans were made - the sand states = Cal, Nev, Fla & AZ

also what KIND of RE loans they were:
The center's research shows that African-American and Latino borrowers were about 30% more likely to get higher-rate subprime loans than white borrowers with similiar risk characteristics.
African-American and Latino communities are likely to lose $373 billion in declining property values between 2009 and 2012.
The report also found that an estimated 2.5 million foreclosures were completed between 2007 and the end of 2009. This is roughly one in every 20 mortgages outstanding at the time of the crisis.
More than eight in 10 of these foreclosures were on owner-occupied homes with mortgage originated between 2005 and 2008.
An estimated 5.7 additional foreclosures are imminent.

Like it or not, that WAS and IS racist.

==============
Foreclosure crisis hits minorities harder
=========

Gold surges to all-time high + RE mortgage interest rates to historic lows

[mEDITate-OR:
not understand that driving UP the price of TBill, and gold, is the fear of risk...
{You do see, do you not, that "the fear of fear itself"
is not the only things we are now afraid of...}

One of the reasons for the sharp decline of RE mortgage interest rates is the panic buying of risk avoidance investments - gold & government guaranteed TBills.

What are they afraid of..., you should not need to ask.
---------------

-------------------
=============
Gold surges to all-time high
=========