produce dis'ed-information 4 U.S.
Another very interesting Graph & Chart site...
While they provide U.S. with 5 each week...
their first one is the most interesting.
The top five - excluding Germany, sorta - show U.S. what is occurring.
And, below is
http://econgrapher.blogspot.com/

We are including both the article small chart and the blown up one, to see how the later posts.
--------
============
Top 5 Graphs of the Week:
Industrial Production, Commodities, Inflation
-----
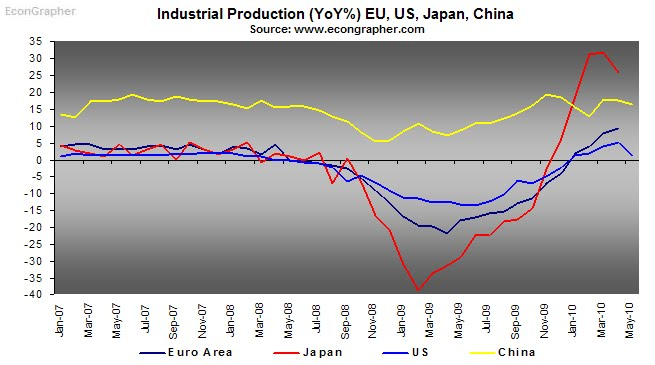
1. Industrial Production
Top 5 Graphs of the Week:
Industrial Production, Commodities, Inflation
-----
1. Industrial Production
Industrial production figures released over the week showed no real surprises with the pattern broadly in line with the expected path from recovery. The US showed a deceleration in Industrial production growth as the comparator figure started to recover; still too soon to call a double dip but it will pay to watch the rest of the data. Japan also saw a slight deceleration in its industrial production recovery - as the trade dependent economy continues to rebound from the deep drops during the height of the crisis. The EU showed continued signs of recovery or renormalisation, and the China data - there for comparison showed continued strength. S Industrial Production has shown a period of deep contraction followed by short term recovery; the question is - where to next?
Click to enlarge images
==========
No comments:
Post a Comment