Tuesday, February 7, 2012

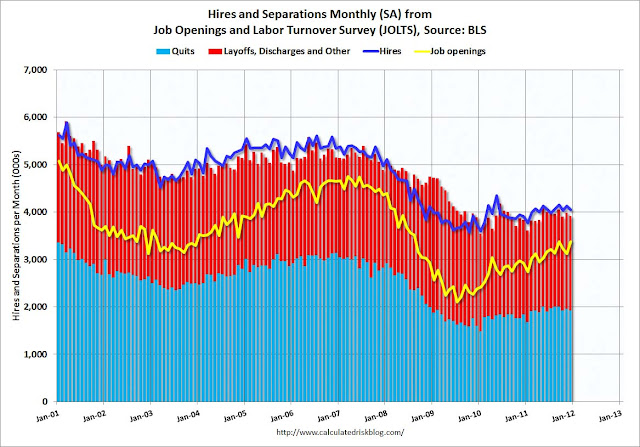
NP = Economic Jolt: Job Openings and Labor Turnover Dec = BLS: Job Openings increased in December

[mEDITate-OR:
not notice something VERY important, if true...
"Voluntary Quits" declined sharply in December..!!!
----------
We NEED to know IF it is true and WHY it happened.
-------------------

---------

-----------
---------
------------
============
Economic Jolt: Job Openings and Labor Turnover Dec
http://paper-money.blogspot.com/2012/02/economic-jolt-job-openings-and-labor.html
------------
BLS: Job Openings increased in December
http://www.calculatedriskblog.com/2012/02/bls-job-openings-increased-in-december.html
==========

Saturday, February 4, 2012

Nevada's triple economic whammy + Obama's failed promises: Nevada edition

[mEDITate-OR:
not wonder how their "luck" could have run out so badly...
----------
maybe they should have asked the Casinos to "run the numbers"
before they placed their bets..., on REAL estate...
-------------------
Nevada has the dubious distinction of leading the nation in
unemployment, 
Foreclosure filings and
number of underwater homes.
That's not good for the state's economy.
--------
JGBellHimself

Since you have admitted that you are a "lawyer", and therefore will end up in Hell, whether you lie or not;
bcuz in all of recorded history - aka, in your law books...
the Old Testament, with all the Jewish lawyers notes in the margin; the New Testament, with all the various Roaming Catholic mandatory "legal" interpretations; and The Koran, with the ONLY true meaning is that in Iran, or possible the Taliban one; or even the Saudi/Sunni one..
and now on the net,
God has never, ever "admitted" a lawyer.

And, the best "proof, beyond a reasonable doubt", for the existence of "God", would now be if he did not make a single exception for you.

But, you did start this story outed with a blatant lie = "The Good Folks at the RNC".

Setting side the issue of which really IS The Worst - the RNC or the DNC - your claim that either of them are "Good", is so ludicrous that if you were in Wa state we would ask to have you committed, for psychiatric "observation"- under the WA Civil Commitment Act - to see if there is ANY evidence - cogent or admissible - that you are, even possibly, in fact, sane.
------------
JGBellHimself

OH, and Dan, where is The One for the Great "State of being" in Arid-Zone-Ah.

We simple cannot wait for reading the Karma (sp?) Sutra position(s) you take on all those illegal immi-grunts that used to surround us, and now have moved over into Texas.

As Seinfeld oft asked U.S.: How much pleasure are you getting out of that?
---------
Nevada has the dubious distinction of leading the nation in unemployment, foreclosure filings and number of underwater homes. That's not good for the state's economy.
-------
Nevada's triple economic whammy
============
Nevada's triple economic whammy
http://money.cnn.com/2012/02/03/news/economy/Nevada_economy/index.htm?iid=Lead
------------
Obama's failed promises: Nevada edition
http://www.examiner.com/right-side-politics-in-national/obama-s-failed-promises-nevada-edition
=============

First, an apology, we've been ill, again...

Some very odd symptoms, too.

We have woken up with the tip of my index finger numb, the one that clicks on the mouse, and found it "pale", as if it is receiving no blood. Then the pinky on my left hand, the one we Brits use to balance our tea cups. Then, even with colour, a tingling - sometimes with full feeling, so no obvious nerve problems; and sometimes no feeling at all other than the tingling.

We have woken up at the coldest point in the morning, and sweating like a gut shot pig...
oh, we know, pigs don't sweat.
but we went to bed without a fever and we woke up without a fever.

Most days we have no problems eating. But, some days just as we are going to bed, we are so sick to our stomachs - oh, we know, we should stop watching those R pseudo-debates - and need to throw up, before we can fall asleep.

Most days we feel fine when we get up, but some quickly change - dull aches in our muscles, and even our bones. And, we become tired, too quickly.
Some days we wake up with a dull headache, some we are simply "dizzy" and have difficulty standing up and keeping our balance.

We have, whenever we feel "tired"...
since the Winter where we contracted full blown pneumonia three times
- one, between Halloween and Thanksgiving (bcuz we remember both of them;
the second time, from almost a week before Christmas until a few days after New Year (bcuz we remember neither of them); and
the third and last time, in the Spring, around St Paddies Day...
....very faithfully gone to bed and slept with the alarm off, for as long as we needed to sleep.
And, that is what we have been doing.

This time we have slept for 4+ hours, or a few as one.
Woke up to take bathroom breaks, and went back to sleep for a few hours more.
Twice we have slept almost half the hours in a 36 or 48 hour period.

Could we, while awake, kept you "posted"...
well, of course.
Please, try to understand that...
while we could have spent all that time in bed with a young, nubile, virgin...
getting in shape for our eternity with our 72 virgins...
but, that would have been a waste of time, since we are not Muslim.
So, when awake we ate and drank all the stuff that is good for us
and when not, we tried to sleep the "rest of the just and sin free"...
apparently with little, to no, success.

However, we ARE still alive
- which, depending on your point of view
- both The Good News and The Bad News.

Tuesday, January 24, 2012

Housing values down steeply in 2012 battleground states

[mEDITate-OR:
not see both where and why Obama is toast.
------
----------

------------

=========
Housing values down steeply in 2012 battleground states
http://www.housingwire.com/2012/01/20/housing-values-down-steeply-in-2012-battleground-states
=========

Saturday, January 14, 2012

Trade Balance Deficit Grows, But Underlying Data Good in Nov + Export and Import Prices Continue to Moderate in Dec

[mEDITate-OR:
not see the huge shifts taking place on all three US Coasts
and on both borders - north and south
---------

----------
As the EURO drops, exports to them from U.S. drop, a lot; but the price to U.S. for buying Porsche 911s, BMWs and Mercedes also drop. True, only the 1% can still afford them, but let'U.S. not be too unfair to them too.
But, if Europe cuts back from U.S., they also might from China. Which, once again, makes Chinese exports TO us more important to their economy. And, will make them FAR less likely to change the value of the Yuan.
At the same time, while we are importing US$ 5 Billion a month from Canada, Mexico and Venezuela, each...
we are not exporting huge amounts of refined fuels to them and the rest of the world.
U.S., an exporter of OIL?
-------
The 1st two charts are very interesting: the 1st shows U.S. only that the trade deficit is getting worse; the 2nd shows U.S. that while that is true, BOTH imports and exports are growing.
The 3rd chart shows U.S. both the seasonal changes , but also the size increases.
The 4th shows that, when inflation is factored, imports without oil increased more than WITH oil.
That is so, bcuz we are reducing our amounts of imported crude oil. And, that is VERY good.
Bcuz we make a LOT more money selling refined fuels, than we are spending to buy the crude to make them, and a lot of that is now using our own supplies
A major economic shift, in favor of U.S.
--------

---------
The two article below are one of the few blog posts that look at both the level of exports and imports, but also the change in prices, and the trends for both.
However, what might be rather interesting to notice is the changes that appear in exports to Europe, and imports from Europe - compared to the changing value of the EURO.
While we should see a decline in European imports from both China and U.S.; are we also seeing an increase in our buying Porsche 911s, BMWs and Mercedes? So, what are the container counts on the East Coast?
And, if we are not buying German cars, why not? How are the German banksters going to loan the PIIGS the money to payoff their debts, so our Wall Street banksters do not have to "cover" them with our CDSs? Tell me that.
=========

-------------

----------

-----------

----------

=========
November 2011 Trade Balance Deficit Grows, But Underlying Data Good
http://econintersect.com/wordpress/?p=17795
------------
Export and Import Prices Continue to Moderate in December 2011
http://econintersect.com/wordpress/?p=17798
==========

Friday, January 13, 2012

Retail Sales: A Disappointing 0.1% in December = Advance Retail Sales Disappoints Christmas Pundits

[mEDITate-OR:
assume that all the excitement...
in not about "The Circus"...!!!
--------
Or, believe that with all "The Elephants" following each other's tales...
that is not really a circle of jerks...
{oh dear, are we having too much pun...}
---------
Back to being somewhat serious...
these two articles, and sets of charts
are very illuminating - about "retail sales"
The 1st chart shows U.S. the "normal" media view - that everything was "up and up"
every month and every year
the 2nd chart suggests that, while we had a "little setback", we are now skyrocketing, again
the 3rd chart suggests that IF we adjust for inflation, we are slowing down, a wee bit
the 4th chart shows U.S. how much better off we would have been IF only W had not been President
---------
Now, the 5th chart is where it gets really disgusting.
Adjusting down, for population growth, for inflation, and for both.
What's up with that?
Didn't we get rid of all those pesky Mexi's?
--------
And, then Doug (selling U.S.?) Short shows U.S. where we really are.
That's enough to make you sick(er) !!!
Not only are we still down 9% below the peak before the RE collapse...
but we are still below the BOTTOM of the 2001 tech crash...
and all the way back to 1998 spending.
--------
It's as if all the benefits of cheap Chinese toys and stuff for Christmas were for nothing.
And, we still, now owe them, US$ 1.5 Trillion.
---------
And, now for something totally different...
that no only are we still in a very big hole...
we are still digging.
------
JGBellHimself
12 Jan, 07:08 PM

While your first point, about consumer debt declining is valid, you either forgot to mention, or consider, where and why, or what that means.

The deleveraging by home owners by foreclosures, strategic defaults, and short sales dwarfs the paydowns on principle by debtors. The deleveraging by retail credit users by bankruptcy, cancelled credit cards and lines of credit, dwarfs the paydowns on outstanding balances.

However, with everyone of Those People their credit ratings have been impaired, if not destroyed. More important, the "equity" that the middle class once had in their homes is gone; and for too many will never come back.

To assume that they will be willing or able to go back to spending as they did is foolish, in the extreme.

Young people cannot find work, returning service people cannot find work, college grads can't find work, or pay for their student loan - and you think nothing has changed?

After 4 years of no recovery
- not jobs, not housing, and as Doug points out to U.S. not in "sales"
what part of an "L" shaped recovery do you not understand?
------------
-----------------
--------
---------------
---------------------------
-------------------
-----------
======
Retail Sales: A Disappointing 0.1% In December
-----------
December 2011 Advance Retail Sales Disappoints Christmas Pundits
=============

Demographic Headwinds: The Decline of Peak Spenders

[mEDITate-OR:
not know that The End is Near....

--------
If this analysis by Doug "selling U.S.Short" is not discouraging enough, you need to read his other article today:
Retail Sales: A Disappointing 0.1% in December
http://seekingalpha.com/article/319181-retail-sales-a-disappointing-0-1-in-december
---------

There he points out:
The Age 45-49 cohort peaked in 2009 and will bottom out in 2022

after an estimated decline of 13.4% from the 2009 population.
The Census Bureau's estimate for 2012 would give us an additional 8.8% decline in numbers for the big spending cohort before bottoming out.
----------
So, not only do we have retiring baby-boomers, but we also have a huge decline in peak year spenders, with a huge decline in their and everyone's ability to borrow and spend.
-----------
The Good News is that with nobody working and paying taxes none of it matters.

The End is Near...!!!
 
Get out your Mayan Calendars...
{so you'll know which day of the month to remember to have sex}


-----------------------

==========
Demographic Headwinds: The Decline of Peak Spenders 
http://www.advisorperspectives.com/dshort/commentaries/Demographic-Headwinds-Decline-of-Peak-Spenders.php
========

Tuesday, January 10, 2012

The massive foreclosure shift..., in Phoenix Foreclosure Patterns Shifting - almost like in a desert "sand state"

[mEDITate-OR:
think that was only an earthquake that you felt...
--------
Below are two posts,
one immediately below, that shows the shift in the RE market for foreclosures in Phoenix.
Two down, is Bill @ CR's take on Sacramento
and
on what he see for this next year.
You need to consider both, to fully see what is now occurring in the "foreclosure market place" and how that is affecting the rest of the RE market.
What was, is not now.
What is developing may not be what you think.
-------
As the song suggests:
"Slow down, you move to fast...
gotta make the morning last."
=====
[mEDITate-OR:
assume that you see what you want to think you can, and must, see...
------------
There has been a very different, but dramatic shift in "foreclosures" in Phoenix over the last year.
--------
bcuz the least expensive home are being sold to all cash investors, the homes that the banks/creditors DO buy are much larger and much more expensive - and, when listed, have far fewer interested buyers.
---------
And, that has two effects: one, when listed both the listing price and the price per sq ft also go up. And, two, IF and when they sell, the "average" sales price and price per sq ft also goes up.
------
The net effect is this - when we remove the least expensive foreclosure homes from the reported MLS and national RE sales reports, ALL of the increases in "average" or "median" prices in Phoenix are fully explained - there was none.
And, the higher priced REOs are also not getting listed - why, bcuz, the REOs only get listed as fast as and to replace those being sold. Higher priced REOs simply are not selling. There is a new, different "hidden inventory".
There are two local Phoenix charts that clearly show this, one just below, and the other in the next post
-------
Note, in the chart from CR
that for Lost Vegas there has been no change
but, that Phoenix's "distressed sales" decline is from 70% to 60%
Or, only 10% lower.
that is still above 50%.
--------

---------

Short Sales ShareForeclosure Sales ShareTotal "Distressed" Share
Dec-10Dec-11Dec-10Dec-11Dec-10Dec-11
Las Vegas25.3%26.6%49.8%46.0%75.1%72.6%
Reno30.0%35.0%39.0%34.0%69.0%69.0%
Phoenix21.3%32.2%48.3%27.6%69.6%59.8%
Sacramento22.6%30.2%44.4%33.9%67.0%64.1%
Minneapolis12.7%14.6%41.7%34.6%54.4%49.2%
Mid-Atlantic (MRIS)11.3%14.3%23.7%15.4%35.0%29.7%

=======
Foreclosures and Short Sale percentages for a few areas
ttp://www.calculatedriskblog.com/2012/01/foreclosures-and-short-sale-percentages.html
-------
Foreclosure Patterns Shifting
http://econintersect.com/b2evolution/blog1.php/2012/01/12/foreclosure-patterns-shifting
========

Trustee Sales In Phoenix Down Again..., Maybe...

[mEDITate-OR
assume that what you see, is...
well, what you see...
----------
Cromford Report:
* foreclosures peaked in February 2009 and then stayed at fairly constant high levels until Q1 2011
* exceptions occurred in March through May 2009 (a government imposed moratorium) and in Q4 2010 (a self-imposed moratorium by Bank of America)
*foreclosures have declined significantly throughout 2011
*the slight upward blips in August and November 2011 made headline news in the local press, but they can be seen here to be almost irrelevant in the context of the overall decline
*the percentage being purchased by investors has increased and is now almost half of all trustee sales
*relatively few homes are now going back to the lenders
------------
And more specifically, by price range:
Homes under $100,000 – Low supply conditions heavily influencing the market. Sales prices are now 6.9% higher than last year.
Homes Between $100,000 and $200,000 -  Supply and demand both move lower. Pricing is still moving up.
Homes Between $200,000 and $400,000 – Supply has fallen and sales are perking up. Pricing remains extremely stable.
Homes Between $400,000 and $800,000 – Supply is down but demand not very strong. Prices stable.
Homes over $800,000 – Supply has stopped growing but demand remains weak. Prices remain remarkably stable.
-------------
JGBellHimself

Absolutely fascinating, is it not.

First, is the massive increase in banks buying their own foreclosures.
What anyone else had to asking themselves was: "Will this price fall even more?"
It did, and they did not buy and loose a lot of money.

Then the foreclosures stabilize, and banks began to sell to "all cash buyers" at the auctions. Bcuz, buyers could believe that while price might still fall some, they probably would not fall too much more. And, if you choose very carefully, your purchase would still be a good one. Total change in the dynamics, no?

Then this last year, the non-bank buyers continue to buy about the same number of foreclosures. BUT, the banks stop buying them. Again, another total change in the dynamics.

However, note that the change in both the 3rd and 4th Q between 10 and 11 was almost ALL the decline in banks buying their own homes back out of auction.

Then compare 4th Q's - in October there was a huge drop, but in Nov this year was almost the same as last year, and while Dec did not go up as much as last year, it did.

What will be very interesting to watch is the 1st Q. Everyone assumes that we will NOT see the same increase we saw last year, and the two years before that.

If that is true, we absolutely WILL see a major turn around in the "Phoenix RE market".
However, if we see the same increases as we did last year, then we will, like it or not, have to wait another year.

Do not hold your breath, but watch it, very closely.
----------
JGBellHimself.
Artur has another very interesting chart from Cromford, that shows the foreclosure sales over the last few year, and who bought them. What that shows U.S. is that there has been a massive shift from banks buying their own foreclosures, and "all cash sales" to non- banks.

Some of that might be BKofA dumping "foreclosures" to raise the cash they have been told they must, to avoid being taken over by The Regulators.

As Mike Orr points out in this report, the number of REOs is way down. But, with banks NOT buying their own foreclosures, that was expected. And, if the banks don't buy them, they never become REOs.

What the chart suggests is that "all cash investors" are now buying IN foreclosure sales and NOT from the MLS.

Two points:
FIRST, what they buy IN foreclosure are probably the least expensive homes. So, the "bottom feeders" never show up in MLS or Cromford's sales. They are long gone before they ever get there. And, so the supply of the least expensive home APPEARS to have dropped, but it might not have. Only shifted from MLS over to IN foreclosure sales.

SECOND,  and so, the only thing left for the banks to buy are the more expensive - ie, the higher priced per sq ft homes. And, therefore the MLS's foreclosure listing simply HAVE to go up, in price,  a lot.

They really haven't...
only what we SEE still there looks like it.
Oh, we know, we are such pessimists.
-----------
trustee sales in phoenix
==========
Trustee Sales In Phoenix Down Again
http://www.phoenixmarkettrends.com/blog/trustee-sales-down.html
========

Reis: Regional Mall Vacancy Rate declines slightly

[mEDITate-OR:
find yourselves..., out shopping...
almost alone.
--------
And, if you think the "strip" - is that not a funny name - malls are vacant were you are...
you should see where we are.
There a more than a dozen brand new strip malls within a few miles of me...
that have NEVER had any tenants.
-------
Bcuz of the time for development, strip and regional malls built out ahead of the subdivisions...
then the subdivisions stopped, they left empty lots...
but, the malls were already built - so, they left empty stores.
-----
The Good News is there are slightly fewer "empty offices"
The Bad News is that offices are moving upscale, downtown and to cheaper spaces
So, now we have not only empty brand new offices bldgs, but a lot of very old ones too.
--------
an average vacancy rate of 9.2% in the quarter
down from the 11-year high of 9.4% in the third quarter
-------------
the vacancy rate for strip malls is just below the record set in 1990.
vacancy [for strip malls] remained at 11%
---------
Only 4.5 million square feet of shopping-center space opened in 2010
the lowest figure in 31 years
----------

========
Reis: Regional Mall Vacancy Rate declines slightly
http://www.calculatedriskblog.com/2012/01/reis-regional-mall-vacancy-rate.html
===========

CR's = Distressed House Sales using Sacramento Data for December + Question #3 for 2012: Will foreclosure activity increase in 2012?

[mEDITate-OR:
assume that "The Foreclosure Problem" has gone away...
------
-------

==========

--------

---------

---------

-------

=========
CR's = 
Distressed House Sales using Sacramento Data for December
http://www.calculatedriskblog.com/2012/01/distressed-house-sales-using-sacramento.html
----------
Question #3 for 2012: Will foreclosure activity increase in 2012?
http://www.calculatedriskblog.com/2012/01/question-3-for-2012-will-foreclosure.html
===========

Monday, January 9, 2012

Consumer Borrowing Soared in November = biggest jump in a decade = surges by $20.4 billion

[mEDITate-OR:
think you're another day older...
and MUCH deeper in debt.
---------

--------

=======
Consumer Borrowing Soared in November
http://www.nytimes.com/2012/01/10/business/economy/consumer-credit-soars.html
----------
Consumer debt sees biggest jump in a decade
Big growth in consumer credit card debt propels overall debt higher
http://www.creditcards.com/credit-card-news/g19-consumer-credit-card-debt-increases-november-2011-1276.php
------------
Consumer borrowing surges as economy improves
http://www.businessweek.com/ap/financialnews/D9S5NTB00.htm
==========

Trade Deficit increased in November to $47.8 Billion + Widens Much More Than Expected In Nov + for first time in 5 months = as exports fall and oil imports rise

[mEDITate-OR:
know what we will see...
but not how much.
-------------
Tradebalance-011312.jpg
---------------
Importexport-011312.jpg
----------

----------

===========
Trade Deficit increased in November to $47.8 Billion
http://www.calculatedriskblog.com/2012/01/trade-deficit-increased-in-november-to.html
----------------
November trade defict hits $47.8 billion
http://www.sacbee.com/2012/01/13/4185247/november-trade-defict-hits-478.html
http://www.boston.com/business/articles/2012/01/13/november_trade_defict_hits_478_billion/
=======

Canada Trade Balance Nov = Canada posts unexpected trade surplus, exports jump

[mEDITate-OR:
not wonder what we will see..
-------

-------
Exports and imports
------------
A shipping container is seen in this file photo. - A shipping container is seen in this file photo. | Getty Images/iStockphoto
--------
Trade balance
=========
Canadian international merchandise trade
http://www.statcan.gc.ca/daily-quotidien/120113/dq120113a-eng.htm
---------
Canada posts unexpected trade surplus, exports jump
=======

China December Trade Surplus Widens Unexpectedly = Surplus $16.5B = Falls for third consecutive year as global demand shrinks for exports + Blame game no help to US

[mEDITate-OR:
---------
chinatrade-011012.jpg
----------------
-----------
Trade surplus continues declining trend
========
Trade surplus continues declining trend
Falls for third consecutive year as global demand shrinks for exports
http://www.chinadaily.com.cn/china/2012-01/11/content_14418485.htm
---------
Blame game no help to US
http://www.chinadaily.com.cn/cndy/2012-01/11/content_14419151.htm
------------
China December Trade Surplus Widens Unexpectedly
http://online.wsj.com/article/BT-CO-20120109-717453.html
---------
China's Trade Weakens; December Surplus $16.5B
http://www.huffingtonpost.com/huff-wires/20120110/as-china-trade/
-----------
China Import Growth Slumps, Deepens Global Risks
http://www.businessweek.com/news/2012-01-10/china-s-dec-export-growth-slows-trade-surplus-widens.html
===========